Almost every organization running scholarships or grants can report how much they gave and who they gave it to. Far fewer can report what it actually did. The gap isn't effort — it's a broken chain that starts long before anyone thinks about measurement.
A leadership team asks a fair question every year: "What did our scholarship — or grant — program actually accomplish?" Not how many applications came in. Not how many dollars went out. What changed because of it.
For most programs, that question is surprisingly hard to answer with anything more than a dollar figure and a headcount. Not because the impact isn't real — but because nobody was collecting the data that would prove it, and by the time someone asks, it's too late to go back and get it.
Measuring impact isn't a step you bolt on at the end of the year. It's the last link in a chain that starts on day one, when you design the application. If an earlier link breaks — the wrong data collected, an unfair review process, no system for following up post-award — you can't get to the end of the chain no matter how good your intentions are in December.
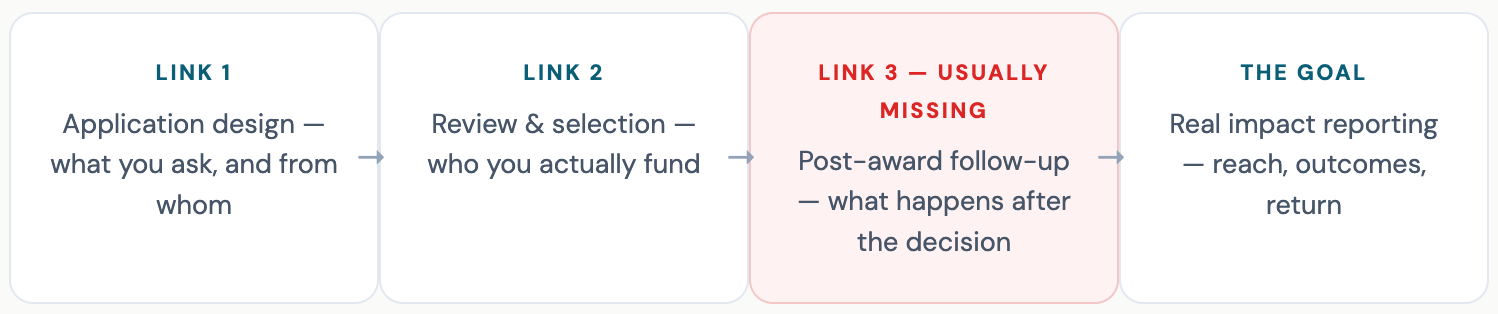
Most scholarship management software and grant management software is built to handle Link 1 — sometimes Link 2. Very few handle Link 3 at all, which is exactly where impact reporting quietly becomes impossible.
Every scholarship or grant program eventually needs an online application. The typical path: someone spins up a form using a general-purpose tool — a web form builder, a survey tool, a shared drive — and calls it done. Applications start flowing in. Then the cracks show: applicants can't save and come back later, there's no way to track who's actually finished, and there's no reminder system to nudge the people who started but stalled out.
The bigger shift worth making: stop thinking of this as "an application" and start thinking of it as a profile — a single record that grows over the applicant's entire journey with your program, from first form field through final impact report. An application is a moment. A profile is a relationship, and relationships are what you actually need data from later.
Mobile-responsive, ADA compliant, and genuinely easy to finish — because your applicants' experience with the process is a direct reflection of your organization, whether they're a student applying for a scholarship or a nonprofit submitting a grant proposal.
Ask eligibility questions up front so nobody wastes time on a scholarship or grant they were never going to qualify for — and if you run multiple funds, match applicants to the ones they're actually eligible for instead of expecting them to figure it out.
People don't complete complex applications in one sitting. They need to log out and come back — and you need visibility into who's stalled so you can nudge them before the deadline, not after.
Letters of recommendation, manager testimonials, funder references — whatever third-party input your process needs, it should route directly to the right person with a notification, not depend on the applicant forwarding an email and hoping.

Even with a great application, the chain breaks if the review process isn't defensible. This matters for a very practical reason beyond fairness: if your funding decisions can't withstand scrutiny, nothing you report about their impact will hold up either. Weak selection undermines strong reporting.
The data across thousands of scholarship and grant review cycles is remarkably consistent, and it points to two numbers worth building your process around:
~30 submissions is roughly where reviewer fatigue sets in — scores drift measurably after this point
3–5 reviews per application is the sweet spot — fewer lacks reliable signal, more is diminishing return
Once you know those two numbers, the math for structuring a fair review is simple: total applications × reviews-per-application, divided by your reviewer pool, tells you exactly how many each person should see — and whether you need more reviewers, more review stages, or both.
What breaks the chain
What holds up
"A score of 24 from one reviewer and 34 from another isn't a 10-point gap — it might be the exact same evaluation from two people with different personal scoring habits. Compare each reviewer to their own average before you compare applicants to each other."
This is the concept of normalization, and it's one of the more overlooked pieces of scholarship and grant management software. Without it, an applicant's odds depend partly on which reviewer they happened to draw — which is exactly the kind of thing that doesn't survive a board asking hard questions later.
Here's where the chain breaks most often, and it's rarely intentional. Once a scholarship or grant is awarded, there are two workflows that should happen next. Nearly every organization runs one of them and skips the other.
Almost always happens
Almost always skipped
Nobody wakes up six months after receiving a scholarship or grant and spontaneously decides to submit an impact report. If your program is reimbursement-based and expects grantees to upload receipts each quarter, they won't do it on time without a system prompting them. The fix isn't more willpower from your recipients — it's a workflow that automatically assigns the right task at the right moment and sends the reminders for you.
Most annual reports stop at reach: how many people or organizations you funded, and for how much. That's not wrong — it's just incomplete. A complete impact report answers three separate questions, and each one requires data you can only get if you built the collection into the process from day one.
The specific metrics differ depending on whether you're running scholarships or grants, and whether the audience is internal (employees, staff, and their families) or external (community members, grantee organizations). But the framework doesn't change — reach tells you volume, outcomes tell you whether it worked, and return connects it back to why you're funding it in the first place.
Vanity metrics
Metrics that mean something
The line between the two columns isn't sophistication — it's whether you built a system to collect the data before you needed it. You cannot retroactively measure something you never asked your scholars or grantees to report.
The organizations that report real impact aren't doing anything exotic. They've simply connected all three links into one system instead of three disconnected tools: a form builder for intake, a spreadsheet for review, and an annual survey — maybe — for impact. Each handoff between those tools is where data quietly disappears.
When application, review, and post-award follow-up live in one profile per scholar or grantee, impact reporting stops being a special project. The information you'd need for a board presentation or a funder report has already been collected as a natural byproduct of running the program well — because the reminders went out on schedule, the check-ins happened at three and six and twelve months, and the data rolled up automatically instead of living in someone's inbox.

The all-in-one platform for managing scholarships, grants and awards programs.